Posts

How To Import Google Analytics Data Into Google Sheets

If you’re like us sometimes you just want to play around with your data a bit more than Google Analytics provides. Maybe you want a different type of chart or simply want to combine your data with some other source. While Google Data Studio is a super useful tool for this type of task, there can be a learning curve in order to get the exact type of data you seek. Enter the Google Analytics Add on for Google Sheets.

What can you do with this data?

If there’s data in your GA account you can pull it into Google Sheets with this plugin. Dates, goals, users, sessions; it’s all there for the taking. What we like to do with this plugin is to leverage this data to create better dashboards than what GA provides as the Sheets plugin allows you to schedule this data to be pulled automatically and thus you can send your team a link that they can access at any time to see fresh data in the format you wish. While the Sheets charts have a long way to go in order to be as useful as Excel, there is still plenty of visualization options at your fingertips.

Take a look at Google’s documentation and tutorial to see what is possible. Then, start putting questions on a white board that your Google Analytics data can provide answers to. Once you know what you’re asking from your data you can begin to query the vast Google Analytics API easily using the Dimensions & Metrics Explorer. As you click on different dimensions or metrics others will gray out if no correlations are available. This Add on is a simple way to start seeing your data in a whole new light and providing better visual insight into new opportunities!

How to Calculate Cost Per Acquisition

Are you willing to buy a $10 bill for $50? Probably not. But if so please email me. Unfortunately many businesses do this transaction every single day by not understanding their true Cost Per Acquisition. It is a very simple task to undertake and ensures that your paid media strategy maintains profitability.

How to Calculate Revenue per Lead

You may have to do some ballparking here, but basically you have to look at your customer base. How much revenue on average does a customer bring to your business? Let’s say that number is $1,000. Next, what is our business margin, meaning; how much can we afford to spend and still stay profitable. Let’s say that number is $250 (eg: a 25% margin). Now, on average how many leads turn into clients? (Leads being calls, form fill outs, etc) Let’s say we average about 75%. The math is pretty simple from here: (Revenue Per Client * Margin) * Lead Conversion = Cost Threshold (for our example; $187.50)

How to Calculate Cost Per Acquisition

Now that we have a Cost Threshold we can work backwards to understand how much we can spend to acquire new leads. We need to review the analytics a bit here to determine our website’s Conversion Rate. Then we can do the math to determine how much we can spend per Conversion; Cost Threshold / Conversion Rate  = Cost per Acquisition (for our example $18.75)

What Are Google Analytics Content Groupings

Not long ago I was doing some analysis on an Ecommerce website in order to determine how visitors navigated through to checkout. The hardest part of this effort was pulling the all pages report out of Google Analytics and conducting some Excel wizardry to filter out just the Product Pages vs. the Product Category Pages. It was time consuming and incredibly monotonous.

Another client was confident about the fact that their Photo Gallery was a top viewed page because it was constantly in the top ten on Google Analytics’ all pages report. They made the usability decision to feature this page front and center on nearly every page on the website. What they overlooked was the fact that they had hundreds of Events Pages and Business Detail Pages that were getting small numbers individually, but in aggregate were the top page types viewed on the site.

What Are Content Groupings?

Google Analytics’ Content Groupings are a way to group similar pages into buckets in order to see user behavior at a more aggregate level. In our Ecommerce example above it allowed us to group all of the Product Pages together in order to see how visitors navigated after seeing any product page. In our second example we were able to determine that the most desirable content was not Photos, but instead Events and Businesses.

How to Set Up Content Groupings

It is super simple to create content groupings. Head on over to your Google Analytics Admin and select the appropriate View. Then select Content Groupings and start creating up to five different content grouping sets. Note that you have three ways to target different content groups:

  1. Tracking Code
  2. Extraction
  3. Rule Definitions

More information on these groups can be found here, but I find that Rule Definitions are pretty robust and fairly easy to implement. Just target pages using Include and Exclude filters the same way that you do when you create Advanced Segments.

You do need to consider the different groupings you may wish to create and also note that groupings don’t talk to each other, so you’ll need to define all pages in each content grouping you create. Below are a few different types of groups we have created fro clients:

  • Products Grouping that identifies Downloadable vs. Hard Copy products
  • Site Sections Grouping that shows us how visitors navigate between Main section pages vs. Sub section pages
  • Listing Pages vs. Detail Pages to see how visitors interact with the main Listing Pages and flow through to the particular Detail Pages

We could list several more, but it really depends on your website. Ask yourself, do you have a lot of a particular type of page (eg: maybe Blog Articles) that individually are very difficult to report on but in aggregate it would make your life easier? If you have any questions about how you might set up content gropings send us an email and lets chat about it!

Digital Strategy Independence Day

On July 4th, 1776 delegates from the 13 original colonies adopted the Declaration of Independence, signifying the birth of American independence. This important date in history allows us to reflect on how the United States of America came to be, but also reminds us of the value of freedom.

Freedom of Cost Data

Any data, whether it be cost, impression, click or otherwise, should be available to you at any time. There are several agencies out there that conduct paid media efforts for their clients but hide vital information such as Return on Ad Spend at a keyword or creative level. This is wrong in our opinion as transparency is what makes us all better partners. The only reason to hide cost data at a granular level is to mask the margin an agency is making on your spend. Request your cost data by keyword, by creative, or by location of ad so that you can review (along with your agency) where optimizations can occur. If your agency won’t release this information then it is time to declare your independence!

Freedom of Segmentation

Not all site visitors are the same as they all have different needs and wants. They will also navigate differently and expect to be spoken to in different ways. By sitting down and thinking through these segments you can then figure out a way to track them more effectively on your website, whether it be through event tracking or custom dimensions, and start learning how different groups interact with your brand differently. Advanced segments in Google Analytics are a great way to track audiences differently so that you can pinpoint different areas where optimization can occur. If you or your agency partner is unable to track visitors separately, then it is time to declare your independence!

You should have full control over your data and all of your marketing accounts. Don’t let your agency partners hide crucial data behind a wall. It is time to declare your data independence and work with true partners that value data transparency with the goal of optimizing your digital marketing strategy!

Google Analytics Data Retention Policy & GDPR

You have to hand it to the Europeans, they really care about their consumers. So much so that starting May 25th, 2018 the European Union (EU) is instituting the General Data Protection Regulation, or GDPR for short. There is a lot going on with this regulation (read MarTech’s handy guide about GDPR) but at its core it is about not storing personally identifiable information. Technically you shouldn’t have been doing this via Google Analytics in the first place, as it violates their TOS. Again, a severe oversimplification there, but that’s kind of the gist.

Google Analytics and GDPR

google analytics data retention settings

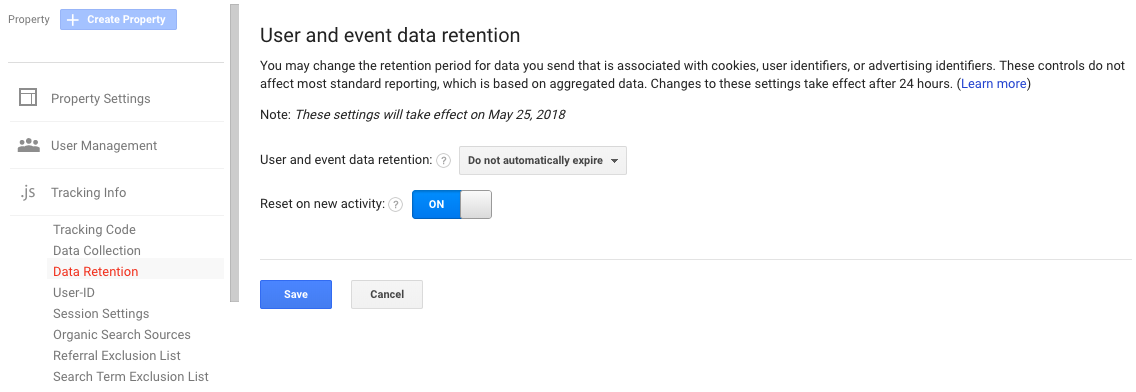
Data Retention settings are under ‘Tracking Info’ in your web analytics Property.

You may have seen an email in your inbox about Google Analytics’ Data Retention Policy and how you now have the ability to adjust your data retention settings. It is kind of a way for Google to ‘pass the buck’ a bit as they are now the ‘co-controller’ of users’ data along with the website owner, but in reality it is the right move because YOU should be in control of your users’ data and not Google. NOTE: Google is defaulting this to 26-months! If you’d like to change this you must login to the analytics admin for each Property, click on Tracking Info >> Data Retention Settings and adjust accordingly. You may also elect to use the “Reset on new activity” option, which is set to ‘Yes’ by default. This means that if a user re-engages with your site their counter restarts (eg: If a user comes to your site, then doesn’t come back for 25-months their information will not be on the block for deletion for ANOTHER 26-months).

GDPR and You

So, technically this only affects citizens of the EU. However, if an EU citizen visits your website you are now liable for their data protection rights under GDRP. So, you can A) Prevent EU residents from accessing your website, or B) comply with GDRP. I guess option C would be to just take the smug American ‘I don’t care’ attitude, but we don’t advocate that here. Again, since Google’s TOS are pretty clear about personally identifiable information you really should already be in compliance.

What Data Does GDPR Affect in Google Analytics?

According to Google; “If you limit the retention of user data to 14 months, then any information associated with conversion events that occurred more than 14 months ago will be lost, for example, the Source, Medium, and Campaign information associated with first_open events that occurred more than 14 months ago.”

But remember, this ONLY affects sites collecting personally identifiable information. So if you are collecting User ID, Client ID, or have personal data in URLs via query string (eg: /page-a?user=bob-smith) then the dire warning above is for you. If not, you’re free! (for now).

What does Bluefin Strategy Advise?

From what we can see (and we are not lawyers), we will be recommending the following settings for our clients:

  • ALL clients should double-check their URL strings to ensure no personally identifiable information is present
  • MOST clients should set Data Retention to “Do not automatically expire” and ensure that any User ID and Client ID capture is removed
  • For those clients that REQUIRE User ID and/or Client ID as part of their reporting we will be advising that they follow Google’s default and expire the data after 26-months

This advice may change down the line, so it’s always best to contact us so we can chat through your specific tracking needs before making a sweeping change to your analytics data.

How to Create Custom Reports & Dashboards

Google Analytics’ standard reports are really great and offer up a wealth of great information. However sometimes this can get overwhelming as you may have to go into multiple reports to get one answer. Both Custom Reports and Dashboards help you overcome this issue by allowing you to combine certain dimensions and metrics together in order to make reporting and analysis easier.

Google Analytics Custom Reports

Custom reporting is really useful for a multitude of reasons, but first and foremost it allows you to see reports for some dimensions that Google Analytics doesn’t report on out of the box. These could be hostname reports (eg: what domains is your GA code firing one), custom dimensions (eg: dimensions you have created in your admin), or to combine out of the box dimensions together (eg: Paid Search Keywords with Time of Day). The second way to look at Custom Reports is from the metrics side of the fence. Google Analytics has standard metrics tables and organize them in the way they want. But what if you want to see Bounce Rate first, then Transaction Revenue second, then Sessions? Custom Reports allow you to organize your columns any which way you want, as well as group your own metrics in any way.

Google Analytics Dashboards

Admittedly the Google Analytics Dashboards aren’t anything to write home about. We here at Bluefin Strategy actually use the Google Analytics API to create our own reports within Google Sheets and then display things the way we want. You may also have more flexibility using Google Data Studio, although that comes with its own limitations. Never the less, if you’re looking for quick and dirty dashboards Google Analytics has you covered. The benefits are that they are easy to create, are retroactive, and you can apply both time comparisons AND advanced segments to them. The latter is the only reason we still use them at all.

From a strategic standpoint use dashboards as the first line of defense. What are the four to five metrics that really matter. What metrics actually affect the conversion on your website and what are the dimensions that matter most. You want your dashboards to be actionable as if they are waving a flag saying “Hey, something is wrong over here”. Don’t clutter them up with useless data points that would not help you make a better conversion decision. If you have more than six dashboard widgets you really need to ask yourself if this is really a “dashboard” or just one big report.

How to Set Up Advanced Segments

When you create a new view filter all of the data starts getting filtered from that day going forward. That’s all well and good, but what about all the data that was gathered before the filter went into place? Well let us introduce you to Google Analytics Advanced Segments.

What are Advanced Segments?

Without overcomplicating things, Advanced Segments allow you to segment or filter data based on a set of rules or filters. You can filter on something as simple as all traffic from Colorado or as complex as only show visitors who viewed page A, B, C but didn’t see D. When you implement the segment it applies to all the reports in Google Analytics, with a few minor exceptions, so you’re able to see how a particular segment navigates your website. Additionally, you can compare up to four segments at once, so you can compare and contrast behavior between different segments.

What to Segment?

There are tons of possibilities of data to segment. Google gives you several segment ideas out of the box, such as Demographics, Technology, Behavior, Traffic Sources, etc. I’m a little old school, so I usually build my own from scratch using “Conditions”. This basically allows you to use AND/OR statements to either Include or Exclude particular traffic. You have access to tons of dimensions and metrics on which you can segment. Additionally you can use “Sequences” to define particular paths or actions that visitors take and filter them out if they don’t follow those paths.

Why use Advanced Segments?

We use segments nearly every day as they allow a retroactive filtering capability to track down issues or to find your most engaged visitors. For instance, we created franchisee advanced segments for a business that had locations all across the country. We used the City dimension and included all of the cities that each franchisee covered. Another example is a school supplies company who offers both hard copy and digital products. We created advanced segments to show us visitors who purchased hard copy vs. digital products to see how they arrived on the site and if they navigated the site differently.

The opportunities for segments is endless (well, within 1,000 or so) so create them to your heart’s content and start going down the rabbit hole to discover your best visitors and optimize their website experience!

How to Set Up Custom Dimensions & Metrics

Back in the day we used to get by with sending specialized user defined variables into Google Analytics. Along with Event Tracking we could really start to paint a pretty granular picture of site behavior and actions. Then came along a new player in town called Custom Variables. This guy allowed us to really take more control over our variables, such as specifying whether it was a page, session or visitor variable. While these variables were great, there were certainly some limitations, especially in the reporting aspect. However with Universal Analytics Google helped solve some of these gaps and brought us to a whole new world of tracking.

What is a Custom Dimension?

Say I have a news site that has multiple content sections. Within those sections I have several different articles. It would be really beneficial to know what site visitors are consuming most of, is it Sports or is it Entertainment? We could create a Custom Dimension for “Section” and fire a ‘hit-level’ custom dimension on each and every page. What about your users? Say I have a log in section where in my CRM I have information about the user, perhaps a “Home Owner” vs. a “Renter”. In this case maybe a fire a a ‘user-level’ custom dimension upon login and therefore I can segment site traffic between those different segments. Google spells out all of the gritty details about custom dimensions here.

What is a Custom Metric?

Without getting too in the weeds (Google explains custom metrics in confusing detail here) I want to paint a few pictures of how you might use a custom metric in the real world. First off a metric is always an integer that can be counted. Whereas a custom dimension is text, custom metrics allow you to start tabulating values. One example might be a real estate site. They could send the home “Asking Price” as a ‘hit-level’ custom dimension and then be able to tabulate the average price of a viewed home (eg: “Asking Price” / “Pageviews”). Or maybe you have a live chat feature and you want to measure the pages where visitors are having to engage with chat more often. You could send a “Live Chat” custom metric at the ‘hit-level’ and be able to view the pages generating the mot live chat engagement. Or better yet, do a calculated metric based on “Pageviews” / “Live Chat” to see the percentage of page viewers who had to engage with chat. Perhaps there’s something on that page requiring attention.

How to set up Custom Dimensions & Metrics?

In the Google Analytics Admin you will want to pop on over to the Property Admin settings and scroll down to “Custom Definitions”. After you click there you have the option to set up both Custom Dimensions and Custom Metrics. Remember to set your strategy first so that you are confident in the scope to use. We like to use a quick spreadsheet that outlines all of our custom definitions along with their scope and a detailed note outlining where/why they are being set.

The examples for custom dimensions and custom metrics go on and on, but our goal here was to provide some strategic guidance into how you might want to set them up. If you’re getting stuck or have any questions feel free to reach out to us!

How to Set Up Event Tracking

Google Analytics’ Event Tracking allows you to easily track user behavior on your website by counting clicks and other actions that visitors do. While we have discussed Event Tracking in the past today we will focus on naming conventions and the strategy for setting them up.

What to Tag With Event Tracking

First off, did you know Google Analytics has a hit limit of 10 million per property per month? For most regular websites this is never an issue, but as you start adding a lot of advanced tagging you may start coming close, so just keep an eye on your usage statistics. That being said, we like to tag just about everything! You never know what you may want to do analysis on so why not track everything you can? Anything that can be clicked that is not an internal link OR is some sort of button or action we want to group together gets an event tag in our book.

How to Name Event Tracking Tags

There are four main naming variables within each event; Category, Action, Label and Value. All are text oriented except for value, this is an integer only. The goal for naming events is to do so in such a way that groups or aggregates them for reporting purposes. For example, “Shopping Cart Buttons” could be the Category for every button within the shopping cart funnel. The Action is often tagged as a “Click”. I despise this strategy because you only have three text fields so why use up one on something as useless as “Click”? In our shopping cart example, maybe Action could be “Continue” or “Add Promo Code”. Obviously this is vastly more helpful than knowing if someone simply clicked a button. Lastly there are Labels. We typically use this variable to track Page Path. We do this so that we can understand what buttons visitors are click8ng on individual pages. Remember that each event group can be viewed individually or together. This means you can look at all Actions that fired on the entire website or just the Actions within a single Category.

Hopefully this helps guide you through your Event Tracking naming conventions, but if you need more help feel free to give us a shout!

How To Set Up Google Analytics Campaign Tracking Variables

We’ve spoken about Google Analytics Campaign Tracking Variables before, but today we want to discuss the strategy behind them. For a quick refresher, Google offers up five open text fields that allow you to specify and describe a link into your website. Remember, ONLY use campaign tracking variables for inbound links to your website and DO NOT use them for internal campaign tracking.

Strategizing Your Campaign Tracking Variables

It is amazingly important to list out your strategy for naming of all five variables. Typically we use a “matrix” of sorts using Google Sheets to make sure we always use the same naming conventions. If you do not use the exact same naming conventions for like variables then they will show up as separate line items. For example, “email”, “Email” and “e-mail” would all show up separately under a Medium report and thus you’d have to add them all together. A matrix allows you to keep track of them all and ensures they will always be properly grouped.

Channel Groupings

Google Analytics already creates a Default Channel Grouping for all your inbound traffic sources. However you may notice that sometimes a Traffic Sources report shows “other”. This is because Google is receiving campaign tracking variables that it does not understand. With the strategy above you’ll also want to make sure that all forms of variables are indeed identified by Google through these channel groupings. You may either just add new rules for any new variables into the Default Channel Groupings or you may add your own group. Keep in mind that you may want to create a group for “Paid” vs. “Non Paid”, or perhaps “Remarketing” vs. “Prospecting”. Google allows for up to 50 different Channel Groupings so filter away to your hearts content.