Digital Marketing In A Recession

We’re data analysts at heart, so when the numbers are telling us something we tend to listen. Many economists agree that a recession is on the horizon. The size and length of such an event is debatable, but regardless of its impact you must be ready. Digital media tactics are agile, allowing you to make quick pivots to your marketing dollars with the click of a mouse. So as the economy weather changes you can act fast and maximize your digital spend.

Marketing Mix In A Recession

It’s hard to pull a television or radio ad. It is nearly impossible to pull a print ad or billboard. While these tactics certainly have their place they are not as easy to adjust when things change economically. It is not always recommended to have a 100% digital marketing marketing mix. It is instead important to have tactics that can be adjusted on a dime when economic uncertainty hits. On the whole we see about a 60-70% mix of digital tactics for most of our clients. Your mix may differ, but shouldn’t be too far away from those percentages.

Web Analytics Are Key

First, make sure all of your digital tactics are properly tagged with campaign tracking variables. Second, review your analytics reports weekly to understand the tactics that are working best. Third, ensure that proper attribution is applied to all tactics in order to understand the full impact of each tactic. If you have offline conversions ensure that there is a tracking mechanism in place in order to properly attribute your tactics.

Optimizing Digital Tactics

As economic forces shift leverage your web analytics data to maximize your digital spend on the tactics with the greatest impact to conversion. Evaluate your attribution funnels, or a multi-channel funnel report in Google Analytics, to ensure your spend is driving results. Decrease spend on those tactics that drive little to no tangible value as economic signs start to weaken. While brand awareness may require some spend, a recession event may not be the best time to do so. Track every dollar spent and if it does not at least assist in a conversion it is time to pull back the reigns. Through these optimization tactics you’ll weather the economic downturn better than most and be ready to spend big once things start looking up.

Need help optimizing your digital marketing during a recession?

Use the form on this page to contact us or simply click here and we’ll be more than happy to help you navigate the choppy economic waters.

How To Develop A Digital Marketing Budget

Sometimes it can feel as though you’re throwing darts blindfolded in order to develop a digital marketing budget. Should we spend more? What is our cost threshold? Or maybe you’re just throwing money at a tactic and hoping for the best. Fear not marketer as your friends from Bluefin Strategy are here to help guide you to something a little better than a dartboard.

Develop A Spend Threshold

You sell widgets for $100. Should you spend $100 on your marketing efforts? OK, that was an easy one (hopefully you answered no). Should you spend $75? $25? There is no right answer per se, although ‘typically’ a marketing budget allocation of about 25% is standard. However you shouldn’t just go for standard. First you need to understand how much it costs to create that $100 widget. Keep in mind all resource, sales, and operations costs. What is left over can be sheer profit or allocated to marketing. This allocation is whatever you feel most comfortable with and, as mentioned before, there is no real hard and fast rule to stick to. Just don’t spend more than you take in of course.

Estimate Your Percentages

Now it is time to dig into your web analytics a bit. Do you have a historical Conversion Rate or Click Through Rate? These will vary wildly based on your business model, but here are some averages we have seen:

Conversion Rates

  • Lead Generation~2.5%
  • Ecommerce ~4%
  • Free Signups ~20%
  • Webinar Registration ~30%

Click Through Rates

  • Display Ads ~0.35%
  • Social Media ~0.90%
  • Paid Search ~2%
  • Email ~5%

Sample Digital Marketing Budget

Now it’s time to put all of that together. Enter the numbers you developed above into our handy Digital Marketing Budget Calculator to get your estimated Cost Per Click and Cost Per Impression Thresholds. Once you have those you can do keyword research to see if the CPC’s align with your thresholds or see if your display ad provider falls under your maximum CPM.

How To Import Google Analytics Data Into Google Sheets

If you’re like us sometimes you just want to play around with your data a bit more than Google Analytics provides. Maybe you want a different type of chart or simply want to combine your data with some other source. While Google Data Studio is a super useful tool for this type of task, there can be a learning curve in order to get the exact type of data you seek. Enter the Google Analytics Add on for Google Sheets.

What can you do with this data?

If there’s data in your GA account you can pull it into Google Sheets with this plugin. Dates, goals, users, sessions; it’s all there for the taking. What we like to do with this plugin is to leverage this data to create better dashboards than what GA provides as the Sheets plugin allows you to schedule this data to be pulled automatically and thus you can send your team a link that they can access at any time to see fresh data in the format you wish. While the Sheets charts have a long way to go in order to be as useful as Excel, there is still plenty of visualization options at your fingertips.

Take a look at Google’s documentation and tutorial to see what is possible. Then, start putting questions on a white board that your Google Analytics data can provide answers to. Once you know what you’re asking from your data you can begin to query the vast Google Analytics API easily using the Dimensions & Metrics Explorer. As you click on different dimensions or metrics others will gray out if no correlations are available. This Add on is a simple way to start seeing your data in a whole new light and providing better visual insight into new opportunities!

How to Leverage Zero Based Budgeting in Digital Marketing

As a myriad of items swirl around the economy these days and idea is beginning to surface in many company boardrooms. Zero Based Budgeting is essentially the review of budgeting line items to ensure viability and efficiency. There’s obviously more to it than that and you can read a great article from McKinsey about the 5th myths of zero-based budgeting to learn more. However, for our intent and purpose we want to leverage this methodology to ensure you’re thinking through your digital marketing expenditures. We’ve written a lot of about budgeting recently and the reasoning is that as we approach the end of the year it is imperative that the budgets you create for 2019 are accurate and viable.

How to Apply Zero-Based Budgeting to Digital Marketing

What is your goal? We ask that a lot, I know. But it is a fundamental question that often is never fully fleshed out. Zero-Based Budgeting forces organizations to think through their goals and revenue targets so that each dollar that goes out is accounted for. It all starts with the organization understanding and agreeing on specific targets, then each department is forced to be accountable to those targets. So to begin, ensure that you understand the revenue goals set by the executive leadership. Secondly, work backwards from your revenue goals (ensuring margin is calculated) by estimating conversion rates and click through rates to determine your overall cost threshold. Lastly, track to these goals by evaluating your return on ad spend on a week-to-week basis. If you’re not on target then evaluate which tactics are throwing things off course. Is it Pay Per Click Advertising? Perhaps it’s particular keywords driving up your cost? Knowing your revenue targets and budgeting to them is job number one as marketers and can ensure that you become a leading voice in the zero-based budgeting game!

Digital Strategists & Zero-Based Budgeting

As any digital strategist worth their salt will tell you, we’ve been doing this for years. The ability to track costs and follow that through to conversion is the cornerstone to any digital marketing plan. More importantly, digital marketers have always had a clear understanding of the full conversion funnel and ensuring that each step along the way is tracked. This gives us a unique opportunity to become leaders within a zero-based budgeting organization and ensure the entire organization accounts for each and every dollar that goes out the door!

How to Calculate Cost Per Acquisition

Are you willing to buy a $10 bill for $50? Probably not. But if so please email me. Unfortunately many businesses do this transaction every single day by not understanding their true Cost Per Acquisition. It is a very simple task to undertake and ensures that your paid media strategy maintains profitability.

How to Calculate Revenue per Lead

You may have to do some ballparking here, but basically you have to look at your customer base. How much revenue on average does a customer bring to your business? Let’s say that number is $1,000. Next, what is our business margin, meaning; how much can we afford to spend and still stay profitable. Let’s say that number is $250 (eg: a 25% margin). Now, on average how many leads turn into clients? (Leads being calls, form fill outs, etc) Let’s say we average about 75%. The math is pretty simple from here: (Revenue Per Client * Margin) * Lead Conversion = Cost Threshold (for our example; $187.50)

How to Calculate Cost Per Acquisition

Now that we have a Cost Threshold we can work backwards to understand how much we can spend to acquire new leads. We need to review the analytics a bit here to determine our website’s Conversion Rate. Then we can do the math to determine how much we can spend per Conversion; Cost Threshold / Conversion Rate  = Cost per Acquisition (for our example $18.75)

What Are Google Analytics Content Groupings

Not long ago I was doing some analysis on an Ecommerce website in order to determine how visitors navigated through to checkout. The hardest part of this effort was pulling the all pages report out of Google Analytics and conducting some Excel wizardry to filter out just the Product Pages vs. the Product Category Pages. It was time consuming and incredibly monotonous.

Another client was confident about the fact that their Photo Gallery was a top viewed page because it was constantly in the top ten on Google Analytics’ all pages report. They made the usability decision to feature this page front and center on nearly every page on the website. What they overlooked was the fact that they had hundreds of Events Pages and Business Detail Pages that were getting small numbers individually, but in aggregate were the top page types viewed on the site.

What Are Content Groupings?

Google Analytics’ Content Groupings are a way to group similar pages into buckets in order to see user behavior at a more aggregate level. In our Ecommerce example above it allowed us to group all of the Product Pages together in order to see how visitors navigated after seeing any product page. In our second example we were able to determine that the most desirable content was not Photos, but instead Events and Businesses.

How to Set Up Content Groupings

It is super simple to create content groupings. Head on over to your Google Analytics Admin and select the appropriate View. Then select Content Groupings and start creating up to five different content grouping sets. Note that you have three ways to target different content groups:

  1. Tracking Code
  2. Extraction
  3. Rule Definitions

More information on these groups can be found here, but I find that Rule Definitions are pretty robust and fairly easy to implement. Just target pages using Include and Exclude filters the same way that you do when you create Advanced Segments.

You do need to consider the different groupings you may wish to create and also note that groupings don’t talk to each other, so you’ll need to define all pages in each content grouping you create. Below are a few different types of groups we have created fro clients:

  • Products Grouping that identifies Downloadable vs. Hard Copy products
  • Site Sections Grouping that shows us how visitors navigate between Main section pages vs. Sub section pages
  • Listing Pages vs. Detail Pages to see how visitors interact with the main Listing Pages and flow through to the particular Detail Pages

We could list several more, but it really depends on your website. Ask yourself, do you have a lot of a particular type of page (eg: maybe Blog Articles) that individually are very difficult to report on but in aggregate it would make your life easier? If you have any questions about how you might set up content gropings send us an email and lets chat about it!

Digital Strategy Independence Day

On July 4th, 1776 delegates from the 13 original colonies adopted the Declaration of Independence, signifying the birth of American independence. This important date in history allows us to reflect on how the United States of America came to be, but also reminds us of the value of freedom.

Freedom of Cost Data

Any data, whether it be cost, impression, click or otherwise, should be available to you at any time. There are several agencies out there that conduct paid media efforts for their clients but hide vital information such as Return on Ad Spend at a keyword or creative level. This is wrong in our opinion as transparency is what makes us all better partners. The only reason to hide cost data at a granular level is to mask the margin an agency is making on your spend. Request your cost data by keyword, by creative, or by location of ad so that you can review (along with your agency) where optimizations can occur. If your agency won’t release this information then it is time to declare your independence!

Freedom of Segmentation

Not all site visitors are the same as they all have different needs and wants. They will also navigate differently and expect to be spoken to in different ways. By sitting down and thinking through these segments you can then figure out a way to track them more effectively on your website, whether it be through event tracking or custom dimensions, and start learning how different groups interact with your brand differently. Advanced segments in Google Analytics are a great way to track audiences differently so that you can pinpoint different areas where optimization can occur. If you or your agency partner is unable to track visitors separately, then it is time to declare your independence!

You should have full control over your data and all of your marketing accounts. Don’t let your agency partners hide crucial data behind a wall. It is time to declare your data independence and work with true partners that value data transparency with the goal of optimizing your digital marketing strategy!

Google Analytics Data Retention Policy & GDPR

You have to hand it to the Europeans, they really care about their consumers. So much so that starting May 25th, 2018 the European Union (EU) is instituting the General Data Protection Regulation, or GDPR for short. There is a lot going on with this regulation (read MarTech’s handy guide about GDPR) but at its core it is about not storing personally identifiable information. Technically you shouldn’t have been doing this via Google Analytics in the first place, as it violates their TOS. Again, a severe oversimplification there, but that’s kind of the gist.

Google Analytics and GDPR

google analytics data retention settings

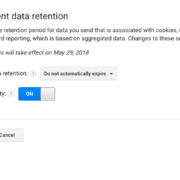
Data Retention settings are under ‘Tracking Info’ in your web analytics Property.

You may have seen an email in your inbox about Google Analytics’ Data Retention Policy and how you now have the ability to adjust your data retention settings. It is kind of a way for Google to ‘pass the buck’ a bit as they are now the ‘co-controller’ of users’ data along with the website owner, but in reality it is the right move because YOU should be in control of your users’ data and not Google. NOTE: Google is defaulting this to 26-months! If you’d like to change this you must login to the analytics admin for each Property, click on Tracking Info >> Data Retention Settings and adjust accordingly. You may also elect to use the “Reset on new activity” option, which is set to ‘Yes’ by default. This means that if a user re-engages with your site their counter restarts (eg: If a user comes to your site, then doesn’t come back for 25-months their information will not be on the block for deletion for ANOTHER 26-months).

GDPR and You

So, technically this only affects citizens of the EU. However, if an EU citizen visits your website you are now liable for their data protection rights under GDRP. So, you can A) Prevent EU residents from accessing your website, or B) comply with GDRP. I guess option C would be to just take the smug American ‘I don’t care’ attitude, but we don’t advocate that here. Again, since Google’s TOS are pretty clear about personally identifiable information you really should already be in compliance.

What Data Does GDPR Affect in Google Analytics?

According to Google; “If you limit the retention of user data to 14 months, then any information associated with conversion events that occurred more than 14 months ago will be lost, for example, the Source, Medium, and Campaign information associated with first_open events that occurred more than 14 months ago.”

But remember, this ONLY affects sites collecting personally identifiable information. So if you are collecting User ID, Client ID, or have personal data in URLs via query string (eg: /page-a?user=bob-smith) then the dire warning above is for you. If not, you’re free! (for now).

What does Bluefin Strategy Advise?

From what we can see (and we are not lawyers), we will be recommending the following settings for our clients:

  • ALL clients should double-check their URL strings to ensure no personally identifiable information is present
  • MOST clients should set Data Retention to “Do not automatically expire” and ensure that any User ID and Client ID capture is removed
  • For those clients that REQUIRE User ID and/or Client ID as part of their reporting we will be advising that they follow Google’s default and expire the data after 26-months

This advice may change down the line, so it’s always best to contact us so we can chat through your specific tracking needs before making a sweeping change to your analytics data.

The Chicken vs. Egg Strategy Approach

Not too long ago we were redesigning a website for a large hospital chain client. During the research phase of the project we reviewed the analytics to find that the ‘Locations’ page was nowhere to be found. We further dug into the numbers and saw that site searches for ‘locations’, ‘hours’, and ‘directions’ were quite high. In the qualitative research phase we talked with customer support specialists and determined that ‘locations’ type questions get asked a lot. Needless to say, when we created the user experience there was a ‘Locations’ link front and center!

Chicken Theory

“That’s just the way it’s always been done!”
This is often a tough one to overcome, especially in a large organization. Web analytics can help sway opinions, but you may have to do some digging. We would not have convinced the CEOs about putting such prominence of the ‘Locations’ link had we not dug deeper into the data. UX can, and should, drive user behavior. But bad UX can drive an undesired behavior and could lead you to make incorrect design decisions. Dig into your data and don’t just settle on the quantitative side. If something doesn’t make sense go deeper and collect more data sets. A developer once told me that he approaches things like a 5-year-old… just keep asking “Why?” until you reach a point where an answer emerges.

Egg Theory

“Hey, let’s bolt this feature on!”
Don’t do this! A strategy is a plan, and a failure to plan is a plan to fail. Bolting on feature sets without understanding how it fits within the larger digital strategy can be immensely harmful to user behavior. It can also wreck havoc on your analytics if it isn’t implemented properly nor tagged, as we discussed in our example. When new features are discussed they must be wireframed and discussed, determining how a real life user would actually use the feature. Oh, and obviously the big one… how will we track their behavior with this feature?

So which is it?

Well, it’s a combination of the two. It is important to think through new features and undertand how they fit into your site’s overall architecture and user experience (The Egg). However, it is just as important to learn from past behavior by asking the right questions and letting a mature site give you UX direction (The Chicken).

How to Create Custom Reports & Dashboards

Google Analytics’ standard reports are really great and offer up a wealth of great information. However sometimes this can get overwhelming as you may have to go into multiple reports to get one answer. Both Custom Reports and Dashboards help you overcome this issue by allowing you to combine certain dimensions and metrics together in order to make reporting and analysis easier.

Google Analytics Custom Reports

Custom reporting is really useful for a multitude of reasons, but first and foremost it allows you to see reports for some dimensions that Google Analytics doesn’t report on out of the box. These could be hostname reports (eg: what domains is your GA code firing one), custom dimensions (eg: dimensions you have created in your admin), or to combine out of the box dimensions together (eg: Paid Search Keywords with Time of Day). The second way to look at Custom Reports is from the metrics side of the fence. Google Analytics has standard metrics tables and organize them in the way they want. But what if you want to see Bounce Rate first, then Transaction Revenue second, then Sessions? Custom Reports allow you to organize your columns any which way you want, as well as group your own metrics in any way.

Google Analytics Dashboards

Admittedly the Google Analytics Dashboards aren’t anything to write home about. We here at Bluefin Strategy actually use the Google Analytics API to create our own reports within Google Sheets and then display things the way we want. You may also have more flexibility using Google Data Studio, although that comes with its own limitations. Never the less, if you’re looking for quick and dirty dashboards Google Analytics has you covered. The benefits are that they are easy to create, are retroactive, and you can apply both time comparisons AND advanced segments to them. The latter is the only reason we still use them at all.

From a strategic standpoint use dashboards as the first line of defense. What are the four to five metrics that really matter. What metrics actually affect the conversion on your website and what are the dimensions that matter most. You want your dashboards to be actionable as if they are waving a flag saying “Hey, something is wrong over here”. Don’t clutter them up with useless data points that would not help you make a better conversion decision. If you have more than six dashboard widgets you really need to ask yourself if this is really a “dashboard” or just one big report.